
Quick answer
Estimate monthly video delivery by multiplying plays × average minutes watched × average delivered bitrate in Mbps × 0.0075. The result is gigabytes using decimal units. Calculate each type of video separately, add the results, then allow for delivery your viewing estimate misses and a busier month. Visits alone are not enough to choose a bandwidth allowance.
For example, 2,000 plays averaging two minutes at a combined video and audio bitrate of 3 Mbps represent about 90GB of media data. That is an estimate, not a provider's exact usage meter. Preloading, repeated downloads and the service's accounting rules can change the recorded total.
This guide gives you a worksheet you can reuse for videos embedded in your website or app. It is about Vidreno Hosting, not the separate On Demand service for film purchases and rentals.
What numbers do you need before calculating?
Start with one row for each video or group of videos with similar viewing behaviour. A homepage clip and a detailed help video should not share the same average simply because both appear on your site.
| Input | What to enter |
|---|---|
| Video starts | Expected playback sessions, including repeat sessions. If unknown, begin with visits to the relevant page multiplied by an estimated play rate. |
| Minutes per start | Average viewing time across those sessions, including short abandoned plays. Use time watched, not automatically the full runtime. |
| Delivered Mbps | The average combined video and audio bitrate served to viewers. Do not substitute the upload file's bitrate or the viewer's connection speed. |
| Additional delivery | Separately estimated downloads, previews or other usage included in your provider's meter but missing from the rows above. |
| Planning reserve | A stated allowance for uncertainty. Record the assumption rather than treating a percentage as a guaranteed safety margin. |
If you have reliable playback totals, use those instead of estimating a play rate. Be consistent: don't count a repeat in both the starts column and an extra replay multiplier. If one session includes repeated sections, its watched duration needs to reflect them.
How does the bandwidth formula work?
Mbps means megabits per second. Multiply by 60 to turn minutes into seconds, divide by eight to convert bits to bytes, then divide by 1,000 to express decimal megabytes as gigabytes. That gives the factor 0.0075.
Monthly media GB = starts × minutes per start × delivered Mbps × 0.0075
The 90GB example is 2,000 × 2 × 3 × 0.0075. At the same viewing time and play count, doubling the average bitrate doubles the estimate. Doubling the minutes watched has the same effect.
Use 1,000GB per TB throughout this worksheet. Some tools report binary units such as GiB instead. Check the unit labels before comparing your result with an allowance.
Can you copy a worksheet for your own website?
Yes. Make these columns in your preferred worksheet and add one row per video group. The formulas below work as ordinary arithmetic even if you prefer a calculator and a notebook.
| Column | Value |
|---|---|
| A | Video or page group |
| B | Monthly page visits |
| C | Estimated play rate, entered as a percentage |
| D | Starts: =B2*C2 |
| E | Average minutes watched per start |
| F | Average delivered Mbps, including audio |
| G | Media GB: =D2*E2*F2*0.0075 |
Use row 1 for the headings and row 2 for the first video group. Copy the formulas down for more groups. If you know starts already, enter that number directly in D and leave B and C unused. For three groups in rows 2 to 4, the total is =SUM(G2:G4).
Put separately estimated additional delivery in G6 and your reserve percentage in G7. A planning total for those three rows is =(SUM(G2:G4)+G6)*(1+G7). Enter 20% as a percentage, not the number 20. Increase the summed range if you add more groups, and keep the extra inputs outside that range.
Here is a fictional business website to show how the rows fit together. These figures are assumptions, not customer results or a Vidreno performance test.
- The homepage receives 24,000 visits, with a 25% play rate: 6,000 starts.
- Product pages receive 8,000 visits, with a 40% play rate: 3,200 starts.
- Help pages receive 4,000 visits, with a 60% play rate: 2,400 starts.
| Video group | Starts | Minutes | Mbps | GB |
|---|---|---|---|---|
| Homepage clip | 6,000 | 0.75 | 2 | 67.5 |
| Product demos | 3,200 | 2.5 | 3 | 180 |
| Help videos | 2,400 | 4 | 1.5 | 108 |
| Total | 11,600 | Varies | Varies | 355.5 |
With additional delivery set to zero for this illustration and a 20% reserve, the planning figure becomes 426.6GB. The reserve is an editorial planning assumption, not a measured overhead rate. Add known extra usage explicitly instead of assuming that 20% will always cover it.
Which bitrate should you use when quality changes?
Use the bitrate actually delivered, weighted by viewing time. Adaptive streaming can switch between different versions as conditions change, so the source file and the highest available quality are not necessarily representative. Cloudflare's explanation of adaptive bitrate streaming describes that process.
For an illustrative mix with 60% of viewing minutes delivered at 2 Mbps and 40% at 4 Mbps, the average is 2.8 Mbps. The percentages are shares of time, not merely shares of viewers. If high quality viewers watch longer, a simple viewer average can underestimate delivery.
If your host does not expose those measurements, calculate a plausible lower and upper case and label the bitrate as an assumption. Do not assign one universal bitrate to “1080p”. The codec, content, encoding choices and audio all matter.
This short video from Wowza explains the idea behind adaptive bitrate streaming. It is useful background for choosing the worksheet input, not a Vidreno tutorial or a current pricing comparison.
Watch the adaptive bitrate explanation on YouTube if the player does not load. The video dates from 2019; use it for the underlying concept rather than current product instructions.
How much room should you leave for a busier month?
Change the inputs, not just the final number. A campaign might bring more starts and longer viewing, while a different device mix changes the average bitrate.
| Scenario | Changes from the base case | Total with 20% reserve |
|---|---|---|
| Quieter | Half as many starts; other inputs unchanged | 213.3GB |
| Base | The assumptions in the worked example | 426.6GB |
| Busier | Twice the starts, 25% longer viewing and 25% higher bitrate | About 1,333.1GB |
The busier case is 355.5 × 2 × 1.25 × 1.25 × 1.20. It is a scenario to budget against, not a forecast that traffic will grow that way. Replace the multipliers with changes that make sense for your release.
A reserve also doesn't explain what your provider does at a limit. Our guide to video hosting allowances and fair use covers that separate question.
How does the estimate compare with Vidreno's plans?
Vidreno Hosting's published plans, checked on 29 September 2026, include 50GB of monthly bandwidth on Free, 5TB on Standard at $12 per month and 50TB on Premium at $59 per month. Storage is separate: 20MB, 10GB and 1TB respectively.
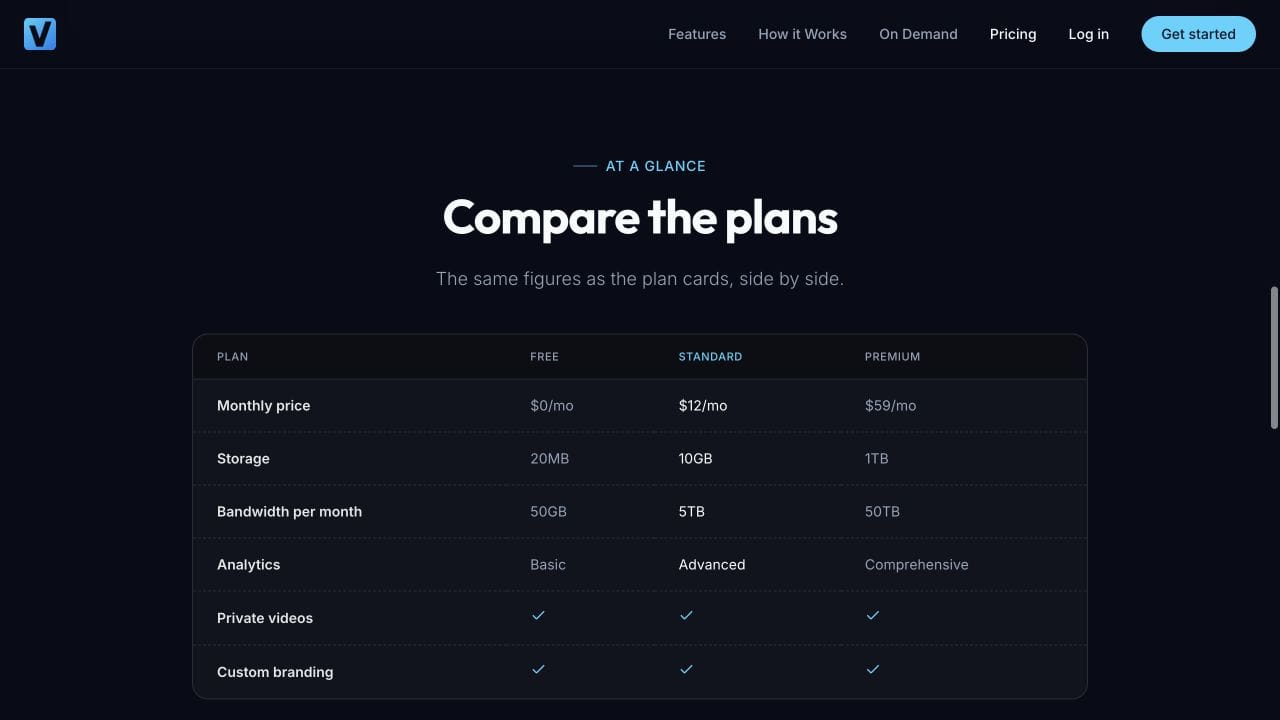
The fictional base and busier cases both fit below Standard's 5TB monthly delivery allowance. That only makes Standard a candidate if the stored library also fits its 10GB storage allowance and the other requirements suit your site. It is not proof that every website with 11,600 starts needs that plan.
For a small clip within Free's 20MB storage limit, the 50GB monthly delivery allowance lets you begin without a hosting subscription charge. Once you need more room, included delivery can make repeated viewing affordable. Our affordable video hosting comparison shows cost examples across different charging models.
What should you check with a real video?
Try a representative clip inside your actual page, on a phone and a laptop. Vidreno's player has a clean layout, and you can change its colours to suit your website. The screenshot and live example below show the genuine homepage demo; they do not establish a particular bitrate or capacity.
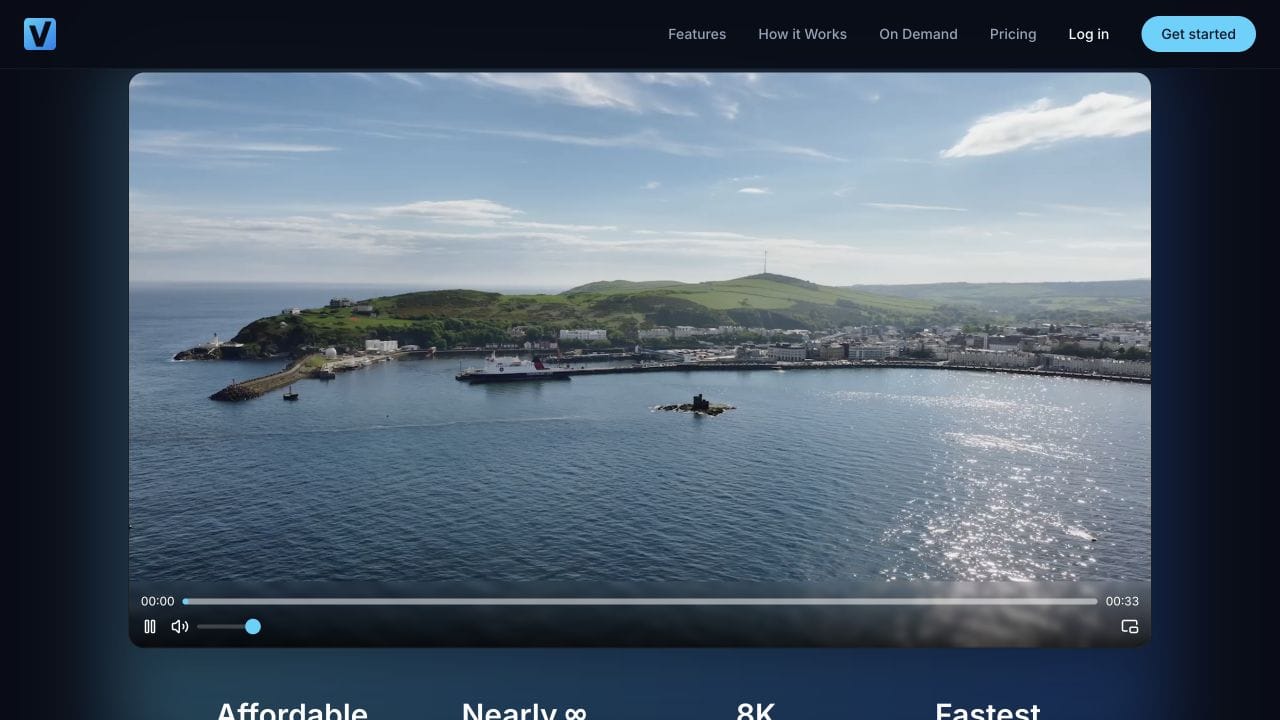
You can also try the player on the Vidreno homepage. After your own video receives traffic, compare the host's measured delivery with the estimate over the same dates. Record which figures include internal tests, downloads or other assets before changing your assumptions.
Where you have compatible measured totals, divide delivered GB by starts to find observed GB per start. Multiplying that by next month's expected starts provides another estimate. Keep it separate from the bitrate method so you do not add the same delivery twice, and reconsider it when viewing behaviour or quality changes.
Frequently asked questions
Is monthly bandwidth the same as connection speed?
No. Here, the plan allowance describes a quantity of data delivered during a month. Mbps describes a rate. You need viewing time to turn a rate into a data quantity.
Does every website visit count as a video play?
No. Use actual starts where available, or estimate the proportion of relevant page visits that start playback. Autoplay and loading behaviour need their own assumptions.
Can I multiply the uploaded file size by views?
Only when that file is actually delivered in full for each counted view. It is a poor shortcut when people watch part of the video or receive different encoded versions.
Does pausing mean all data transfer stops immediately?
Not necessarily. A player can have downloaded media ahead of the current viewing position. Use measured delivery to refine the estimate instead of treating watched seconds as an exact usage meter.
Should I add every available quality version together?
Not for each viewing minute. Estimate the version delivered during that minute. Adding all encoded versions would confuse what is available with what a viewer actually receives.
Does a larger delivery allowance mean my library will fit?
No. Check stored file size separately. A plan can have plenty of monthly delivery while offering less storage than your library needs.
Build your estimate from the way people watch, then compare both the normal and busier cases with the plan. Start with a small real video, keep your assumptions visible and replace guesses with measured usage as it arrives.